The Golden Cross Myth: Does the Most Popular Trading Strategy Work?

Open any trading education platform, and you’ll find the “Golden Cross” presented as a reliable strategy. Investopedia calls it a “bullish breakout pattern.” StockCharts.com mention it as a trend reversal indicator. Trade Brigade labels it “the true Golden Cross strategy.”
While at least some also state a fair warning its not as much it should be warn agains. Unless you are granny forecasting last year weather to this year car production. Lets tear this strategy down.
What is Golden Cross in trading?
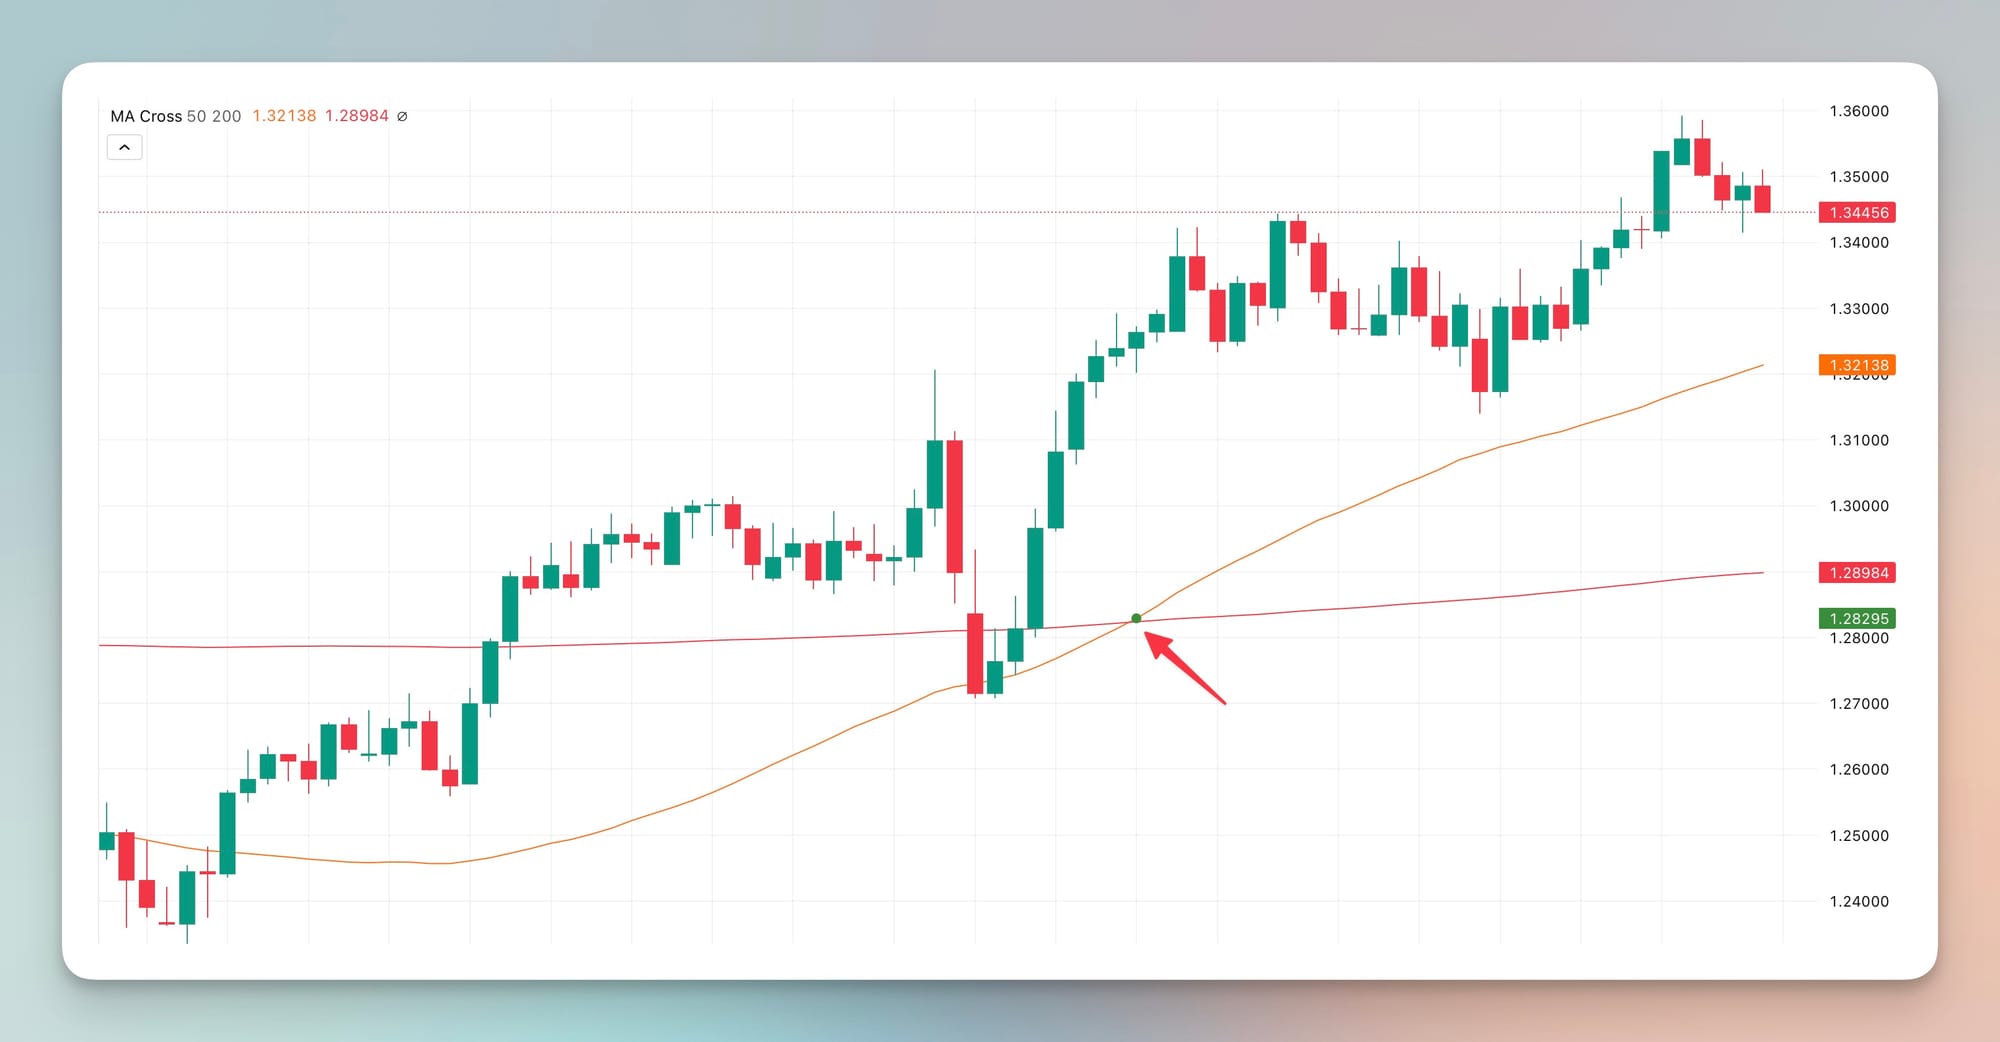
The concept seems foolproof: when the 50-day moving average crosses above the 200-day moving average, it signals a strong uptrend. Buy the breakout, ride the trend, profit from the "reliable" signal.
The Golden Cross Myth: Why The Most Popular Trading Strategy Is A 13% Annual Loss
This "legendary" strategy that trading gurus promote endlessly just delivered a devastating 0.19% annual return over 10 years while SPY returned 13.11%. That's a staggering 12.9% annual underperformance.
Let me show you exactly why this celebrated strategy belongs in the trading graveyard, not your portfolio.
The Brutal Backtest Reality
I implemented the classic Golden Cross strategy using SPY from 2015 to 2025 with $20,000 starting capital. Following prudent risk management principles, I allocated only 2% of capital per trade. A reasonable approach for active trading strategies. The results were worse than I expected:
Golden Cross Performance:
- Annual Return: 0.19%
- Total Return: 1.93% (over 10 years)
- Sharpe Ratio: 7.49 (misleadingly high due to minimal activity)
- Maximum Drawdown: 0.5%
- Win Rate: 60%
- Total Trades: 10
- Total Fees: $10
The Golden Cross strategy underperformed simple buy-and-hold by a devastating 12.9% annually. Your $20,000 would have grown to $20,386 with Golden Cross versus $49,336 with SPY. That's $28,950 in lost opportunity.
But here's where the position sizing reveals an even more brutal reality: these returns represent only 2% of the total portfolio. The actual impact on the $20,000 portfolio was a mere 0.004% annual return, while the remaining 98% sat in cash earning nothing.
Why The Golden Cross Fails Catastrophically
The Signal Lag Problem
Moving averages are inherently backward-looking. By the time the 50-day MA crosses above the 200-day MA, significant price movement has already occurred. You're buying after the initial surge, not before it. This lag effect means you consistently buy high and sell low, the exact opposite of profitable trading.
Rare Signal Frequency
The Golden Cross generated only 10 trades over 10 years. That's one trade every 12 months on average. During most market periods, especially choppy sideways markets, the strategy sits in cash earning nothing while opportunity costs compound.
I discovered something revealing in the trade logs: the strategy spent approximately 70% of the backtest period in cash, completely missing the massive bull market from 2016-2021. While SPY participants enjoyed unprecedented gains, Golden Cross followers watched from the sidelines.
The Whipsaw Massacre
When Golden Cross signals do occur, they often happen during volatile periods that generate multiple false signals. The strategy gets whipsawed: buying on false breakouts, selling on temporary dips, then buying again at higher prices. Each whipsaw costs money in fees and poor timing.
Market Regime Blindness
The Golden Cross treats all market conditions identically. It applies the same 50/200 day logic during low-volatility grinding markets and high-volatility crash scenarios. This one-size-fits-all approach ignores the reality that different market regimes require different strategies.
The Misleading Sharpe Ratio
The reported Sharpe ratio of 7.49 deserves special attention because it illustrates how meaningless this metric becomes with inactive strategies. This exceptionally high ratio results from the strategy's minimal volatility, not superior risk-adjusted returns.
When a strategy barely trades and sits in cash most of the time, its volatility approaches zero. Since Sharpe ratio equals (return - risk free rate) / volatility, near-zero volatility can produce artificially inflated ratios. This is exactly what happened here: 0.19% returns with virtually no volatility created a mathematically high but practically meaningless Sharpe ratio.
This demonstrates why I consistently warn against Sharpe ratio worship. A 7.49 Sharpe ratio sounds impressive until you realize it represents 0.19% annual returns. I'd rather have SPY's 0.54 Sharpe ratio with 13.11% annual returns any day.
The Position Sizing Mathematics Trap
The 2% position sizing, while prudent for risk management, exposes trading's cruel mathematics. Even if the Golden Cross had worked perfectly and matched SPY's 13.11% annual return, it would have contributed only 0.26% annually to the total portfolio (2% × 13.11%).
This creates an impossible dilemma for active traders:
Conservative Position Sizing (2%): Even successful strategies barely impact total returns. The Golden Cross's actual 0.004% annual contribution is mathematically irrelevant to wealth building.
Aggressive Position Sizing (50%+): Higher allocations amplify both gains and losses. When strategies inevitably fail like Golden Cross, aggressive sizing turns poor performance into portfolio devastation.
Buy-and-Hold Alternative: Uses 100% allocation to capture market returns directly, eliminating the position sizing penalty entirely.
The Opportunity Cost Disaster
The most painful aspect of Golden Cross failure isn't the poor returns, it's the massive opportunity cost compounded by conservative position sizing. While 2% of the portfolio earned 0.19% annually through Golden Cross signals, the remaining 98% earned essentially nothing in cash.
This means Golden Cross investors missed one of the greatest bull markets in history on 98% of their capital while their "sophisticated" 2% allocation delivered negligible returns. The strategy didn't just fail—it institutionalized missing out on wealth creation.
Better Alternatives That Actually Work
Instead of chasing moving average crossovers, consider these evidence-based alternatives:
Simple Buy and Hold: The SPY benchmark destroyed Golden Cross by 12.9% annually with minimal effort. Sometimes the boring approach wins.
Momentum Strategies: If you want systematic approaches, focus on price momentum over specific timeframes rather than moving average crosses. Recent research shows 3-12 month momentum strategies outperform crossover systems.
Market Timing with Real Indicators: If you insist on market timing, use indicators that respond faster than 200-day moving averages. RSI divergences, volume analysis, or even simple trend line breaks provide earlier signals.
The Marketing Machine Behind The Golden Cross
Understanding why Golden Cross remains popular despite consistent failure requires examining the marketing incentives. Trading educators love Golden Cross because it's simple to explain and appears sophisticated enough to justify course fees.
Brokerage firms promote it because frequent signals generate transaction fees. Financial media covers it because moving average crosses create compelling headlines and clear chart graphics. Everyone profits from Golden Cross mythology except the people actually trading it.
What I Learned From This Failure
This backtest reinforced several crucial lessons about systematic trading:
Signal clarity doesn't equal profitability. The Golden Cross provides crystal clear buy/sell signals that consistently lose money. Complex markets rarely respond to simple solutions.
Position sizing creates impossible trade-offs. Conservative sizing makes even winning strategies irrelevant, while aggressive sizing turns losses into disasters. Buy-and-hold eliminates this dilemma entirely.
Backtesting reveals truth. Without rigorous testing, the Golden Cross sounds reasonable. Only empirical analysis exposes its devastating underperformance.
Opportunity cost compounds with inactivity. The Golden Cross didn't just underperform—it institutionalized missing the greatest bull market in history on 98% of invested capital.
The Bottom Line
The Golden Cross myth persists because it feels scientific and removes emotional decision making from trading. Unfortunately, removing emotion while maintaining poor strategy simply creates systematic losses instead of random ones.
After testing this strategy thoroughly, I can definitively state: the Golden Cross is trading fool's gold. It glitters with the promise of systematic profits while delivering systematic underperformance.
Your money deserves better than a 0.19% annual return in a market that delivered 13.11%. Sometimes the boring buy-and-hold approach isn't just simpler, it's vastly superior.
Educational Disclaimer: Everything on Backtest Arena is for educational purposes only. I'm not your financial advisor, and this isn't investment advice. I'm here to show you what doesn't work in trading, not to tell you what to buy or sell. All backtest results use historical data - markets change, and past performance means nothing for future results. Trading is risky and most people lose money. Do your own research and consult a qualified professional before risking real capital.